Deliveries Overview
Deliveries represent individual notifications sent to your subscribers. Every notification—whether sent manually, via RSS automation, or as part of an A/B test—creates a delivery record you can track.
Accessing Deliveries
- Navigate to your app
- Click Deliveries in the app menu
Delivery List
The deliveries page shows all notifications for your app:
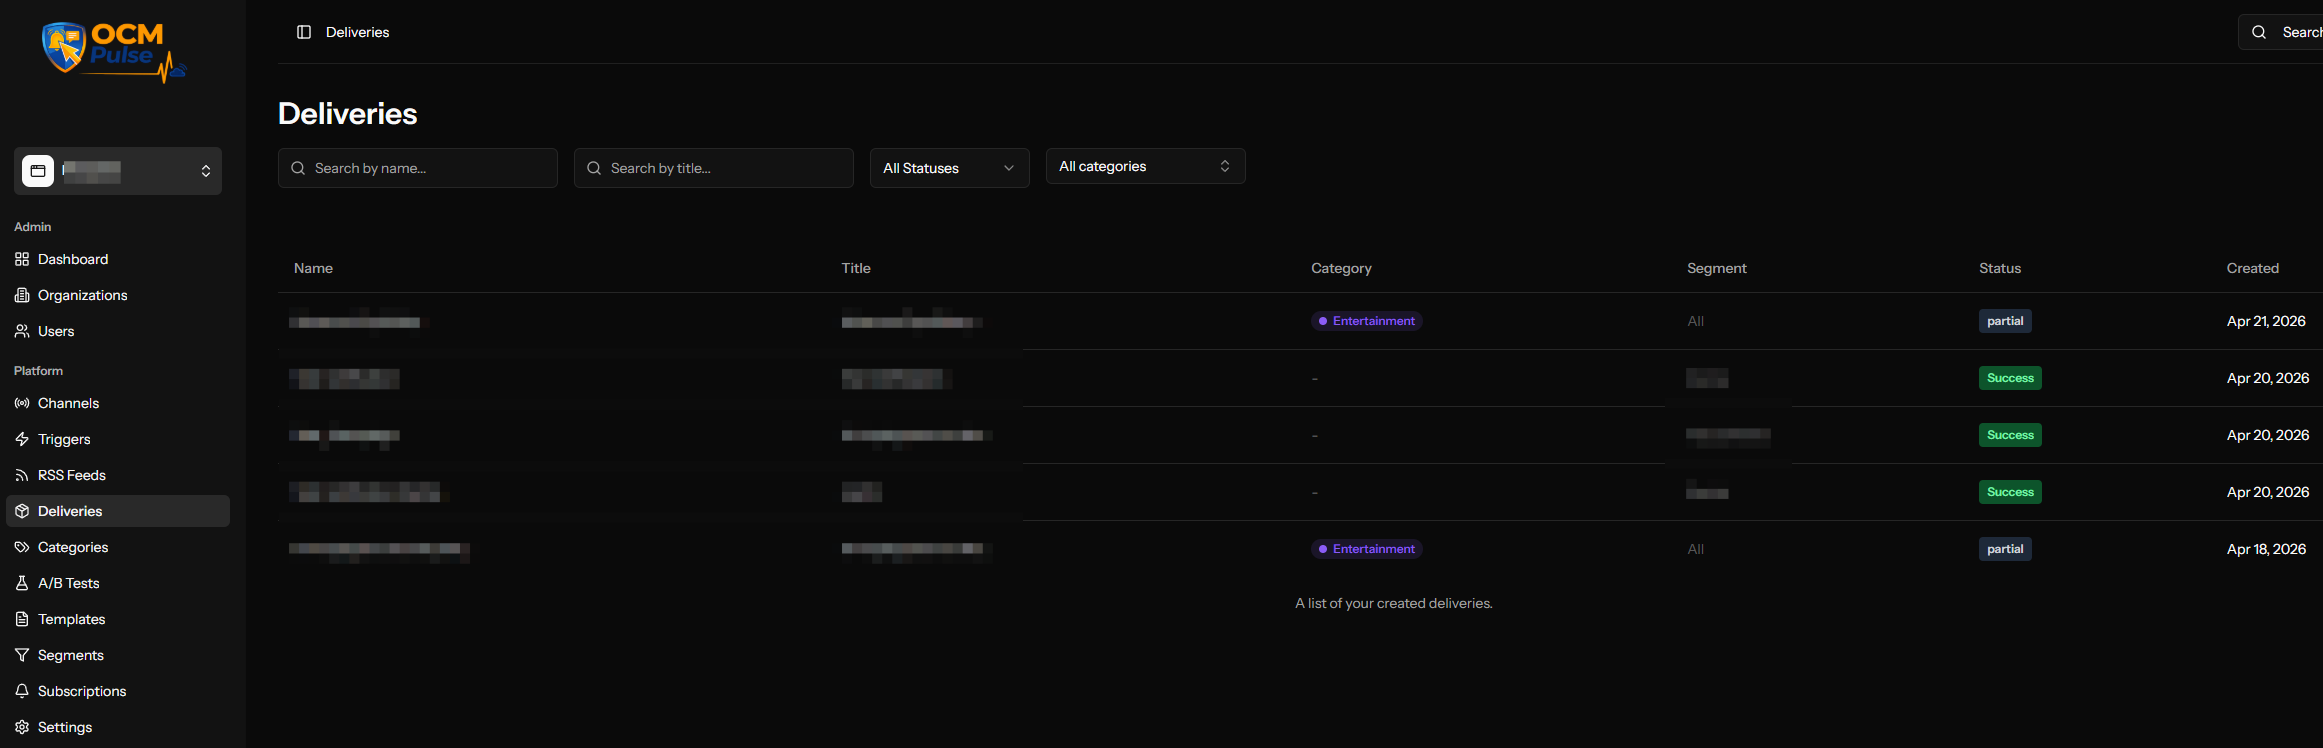
Columns
| Column | Description |
|---|---|
| Name | Internal name (required on every delivery, including RSS and A/B test rollouts) |
| Title | Notification headline |
| Category | Color-coded category badge |
| Segment | Target segment or "All" |
| Status | Current delivery status |
| Created | When the delivery was created |
Filtering
Filter your deliveries by:
- Name - Search by internal name
- Title - Search by notification title
- Status - Filter by delivery status (Pending, Scheduled, Queued, Processing, Partial, Success, Failed, Cancelled)
- Category - Filter by category (including "Uncategorized")
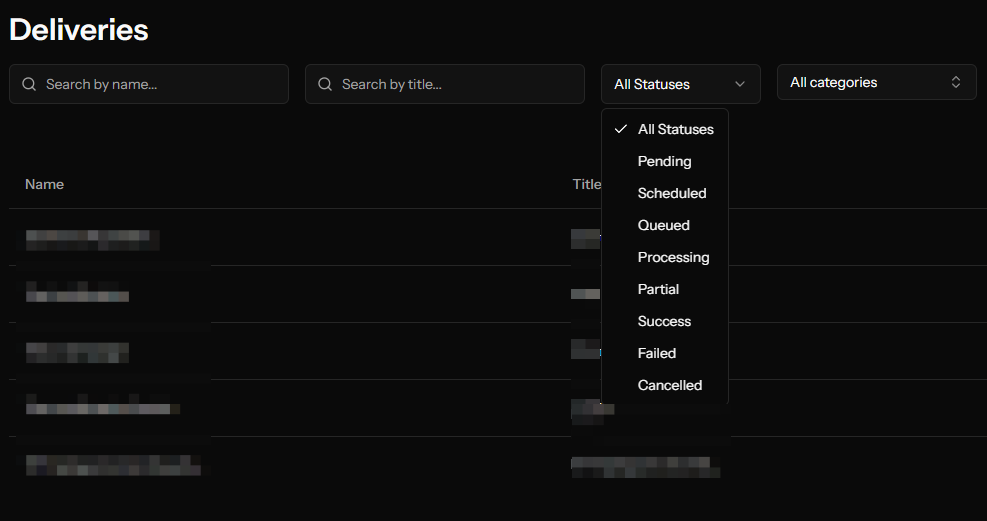
Click Clear to remove all filters.
Delivery Status
Each delivery has a status indicating where it is in the lifecycle:
| Status | Badge | Description |
|---|---|---|
| Pending | Gray | Just created, about to be queued |
| Scheduled | Purple | Waiting for scheduled time |
| Queued | Gray | In queue, waiting to be processed |
| Processing | Yellow | Currently being sent |
| Success | Green | All notifications delivered |
| Partial | Yellow/Green | Some delivered, some failed |
| Failed | Red | All notifications failed |
| Cancelled | Orange | Manually cancelled |
Status Flow
Created → Pending → Queued → Processing → Success/Partial/Failed
    ↓                           ↑
Scheduled → [wait] → Processing-┘
    ↓
Cancelled (any time before Success)
Delivery Details
Click any row to open the details panel.
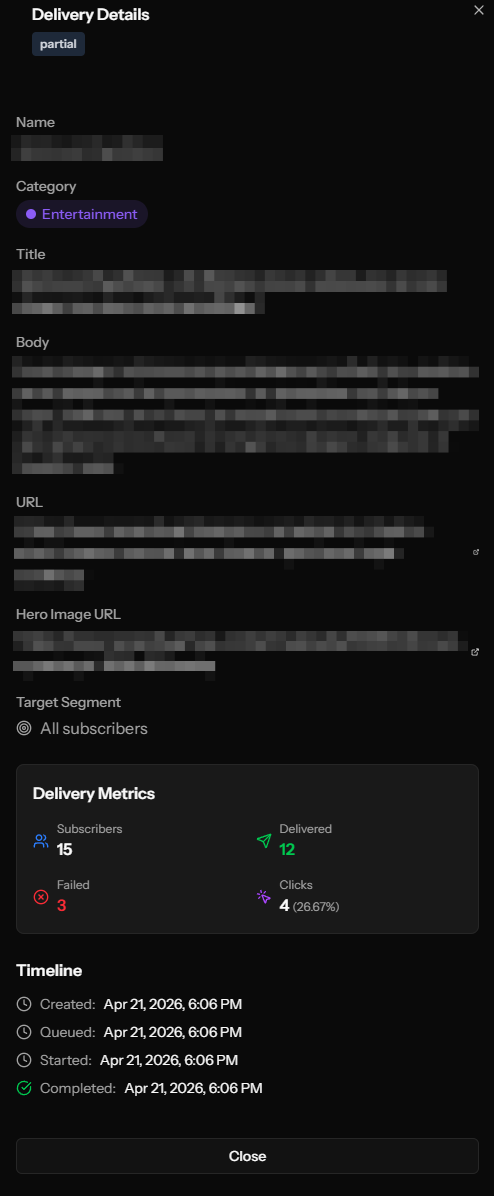
Content Section
- Name - Internal identifier
- Category - With color indicator
- Title - Notification headline (bold)
- Body - Full message text
- URL - Click destination
- Image - Hero image URL (if set)
- Segment - Target audience
Frequency Cap Indicator
If the delivery bypassed frequency capping, you'll see a notification:
"This delivery ignored frequency capping"
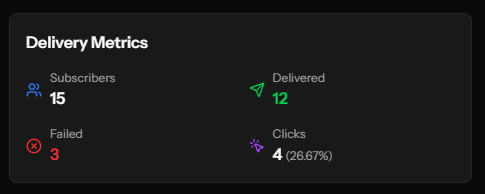
Metrics
| Metric | Description |
|---|---|
| Total Subscribers | Number targeted |
| Capped | Number excluded by frequency cap |
| Delivered | Successfully sent |
| Failed | Failed to deliver |
| Clicks | Total clicks received |
| Click Rate | Percentage who clicked |
Timeline
See exactly when each stage happened:
| Event | Description |
|---|---|
| Created at | When delivery was initiated |
| Scheduled for | Planned send time (if scheduled) |
| Queued at | When added to processing queue |
| Started at | When sending began |
| Completed at | When all sends finished |
Error Messages
If a delivery failed, the error message appears at the bottom of the details panel.
Cancelling a Delivery
You can cancel deliveries that haven't completed:
- Click the delivery to open details
- Click Cancel button
- Confirm in the dialog
What can be cancelled:
- Scheduled deliveries (before send time)
- Pending deliveries
- Processing deliveries (stops remaining sends)
What cannot be cancelled:
- Completed deliveries (Success, Partial, Failed)
- Already cancelled deliveries
Real-Time Updates
The deliveries list automatically refreshes when deliveries are in progress:
- Updates every 5 seconds
- Shows live status changes
- Displays updated metrics
This stops when all deliveries reach a final state.
Understanding Metrics
Delivered vs. Success Count
Delivered (Success Count) means the notification was:
- Accepted by the push service
- Sent to the subscriber's device
It does NOT guarantee the user saw it (they may have Do Not Disturb on).
Failed Count
Failed means the notification could not be delivered:
- Subscription expired (user unsubscribed via browser)
- Push service rejected the notification
- Invalid subscription data
Failed subscriptions are automatically marked inactive.
Capped Subscribers
When frequency capping is enabled:
- Some subscribers may be skipped
- They've already received the maximum notifications
- This is shown in the "Capped" metric
Click Rate Calculation
Click Rate = (Clicks / Delivered) × 100%
Industry average click rates for web push are typically 2-5%.
Delivery Sources
Deliveries come from different sources:
| Source | Description |
|---|---|
| Manual | Created through the Manual Trigger |
| RSS | Auto-created from RSS feed items |
| A/B Test Variant | Part of an A/B test |
| A/B Test Rollout | Winner sent to remaining subscribers |
Tips for Better Deliveries
Timing
- Send when your audience is most active
- Avoid late night/early morning
- Consider timezone differences
Content
- Keep titles compelling and short
- Make the body actionable
- Ensure URLs work and load quickly
Frequency
- Don't over-send
- Use frequency capping appropriately
- Monitor unsubscribe rates
Analysis
- Review click rates regularly
- Identify best-performing content types
- Learn from failed deliveries